жңҖеҫҢж–°ж–°: 2015-05-22
д»Ӣзҙ№
nload, vnstat, е®ғеҖ‘йғҪжҳҜ console дёҠзҡ„ traffic monitor дҫҶ
е®ғеҖ‘еҹәжң¬дёҠйғҪжІ’жңүе°Қе…¶д»– package зҡ„дҫқиіҙ, еҸӘиҰҒжңү /proc/net/dev е°ұеҸҜд»Ҙе·ҘдҪң
д»ҘдёӢдёҖдёҖд»Ӣзҙ№, йҰ–е…Ҳз”ұ nload иӘӘиө·, еӣ зӮәе®ғжҳҜжңҖз°Ўе–®зҡ„.
зӣ®йҢ„
- nload
- vnstat
- ifstat
- iftop
- ntop
- nethogs
nload
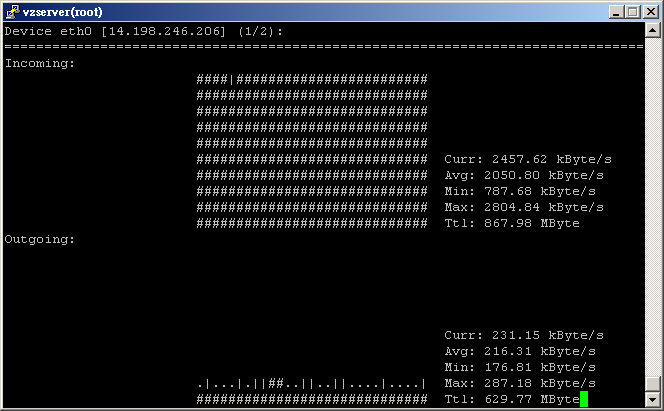
nload жҳҜз”ЁдҫҶжҹҘзңӢжҹҗд»Ӣйқўзҡ„еҚіжҷӮ in/out жөҒйҮҸзҡ„е·Ҙе…·
з”Ёжі•:
nload [-u Unit] [devices]
- Unilt: -u h|H|b|B|k|K|m|M|g|G # h means human readable (auto), b Bit/s, B byte/s
- devices # жҳҜеҸҜд»ҘеӨҡеҖӢдёҖеҖӢ, д№ӢеҫҢз”Ё page up / down еҲҮжҸӣ
- -i # з•«ең–з”Ё. иЁӯе®ҡ incoming 100% жҷӮзҡ„йҖҹеәҰжҳҜе№ҫеӨҡ, е–®дҪҚдёҖе®ҡжҳҜ kbit/s
- -o # з•«ең–з”Ё. иЁӯе®ҡ outgoing 100% жҷӮзҡ„йҖҹеәҰжҳҜе№ҫеӨҡ, е–®дҪҚдёҖе®ҡжҳҜ kbit/s
For Example:
#nload -uK eth0 eth1
# nload -i 102400 -u m
Device eth0 (2/10):
================================================================================
Incoming:


                                                       Curr: 12.64 MBit/s
                                                       Avg: 11.24 MBit/s
                                                       Min: 7.71 MBit/s
                                                       Max: 13.24 MBit/s
                                         ############  Ttl: 93.46 GByte
Outgoing:


                                                       Curr: 0.21 MBit/s
                                                       Avg: 0.19 MBit/s
                                                       Min: 0.13 MBit/s
                                                       Max: 0.22 MBit/s
                                                       Ttl: 53.48 GByte
vnstat
еҰӮжһңе–®жҳҜжҹҘзңӢеҚіжҷӮзҡ„з¶ІзөЎжғ…жіҒ, nload 已經еҫҲи¶іеӨ дәҶ.
дёҚйҒҺеҰӮжһңжғіеҒҡжӯӨзөұиЁҲзҡ„и©ұ, йӮЈе°ұиҰҒз”ЁдёҠ vnstat.
е®ғеҸҜд»Ҙд»Ҙе°ҸжҷӮ(-h), ж—Ҙ(-d), жҳҹжңҹ(-w), жңҲ(-m)дҪңе–®дҪҚдҫҶеҒҡйҖҹеәҰзөұиЁҲ
vnstat жҳҜз”ұ kernel зҚІеҫ—жүҖй Ҳж•ёж“ҡ
еҚіжҷӮжөҒй–“:
vnstat -l -i eth0
Monitoring eth0...    (press CTRL-C to stop)

   rx:       2.66 kB/s    13 p/s            tx:       3.44 kB/s    19 p/s
- -l, --live
- -i, --iface
е»әз«ӢзөұиЁҲ Database:
vnstat -u -i eth0 --nick gateway
- -u жҳҜжӣҙж–°иЁӯе®ҡзҡ„ж„ҸжҖқ.
- --nick nickname
е»әз«ӢиіҮж–ҷеә« /var/lib/vnstat/eth0, дёҰдё”иЁӯе®ҡ nick_name
Default DB зҡ„е‘ҪеҗҚ: /var/lib/vnstat/eth0
收йӣҶиіҮж–ҷжңүе…©зЁ®ж–№ејҸ, дёҖжҳҜ cron, еҸҰдёҖзЁ®жҳҜ Daemon
е»әз«Ӣ cron job:
е»әиӯ° update жҷӮй–“: 32 bit: 100 Mbit = 5min
vnstat -u -i eth0
еҒңз”Ё:
--delete # Delete the database for the selected interface and stop monitoring it.
vnstat -i eth2 --delete
Daemon
/usr/sbin/vnstatd -d
Configure File
/etc/vnstat.conf
Interface "eth0"

DatabaseDir "/var/lib/vnstat"
MonthRotate 1

# 0 = IEC standard prefixes (KiB/MiB/GiB/TiB)
# 1 = old style binary prefixes (KB/MB/GB/TB)
UnitMode 0

# used rate unit (0 = bytes, 1 = bits)
RateUnit 1

# how many seconds should sampling for -tr take by default
Sampletime 5

# filesystem disk space check (1 = enabled, 0 = disabled)
CheckDiskSpace 1

# database file locking (1 = enabled, 0 = disabled)
UseFileLocking 1

######################################################### vnstatd

# how often interface data is updated(in seconds)
UpdateInterval 30

# how often interface status changes are checked(in seconds)
PollInterval 5

# how often (in minutes) data is saved to file
SaveInterval 5

# force data save when interface status changes (1 = enabled, 0 = disabled)
SaveOnStatusChange 1

# enable / disable logging (0 = disabled, 1 = logfile, 2 = syslog)
UseLogging 2

LogFile "/var/log/vnstat.log"
PidFile "/var/run/vnstat.pid"
жҹҘзңӢзөұиЁҲ:
vnstat -q
Database updated: Wed Jun 10 17:20:37 2015

   br0 since 06/10/15

          rx:  184 KiB      tx:  263 KiB      total:  447 KiB

   monthly
                     rx      |     tx      |    total    |   avg. rate
     ------------------------+-------------+-------------+---------------
       Jun '15       184 KiB |     263 KiB |     447 KiB |    0.00 kbit/s
     ------------------------+-------------+-------------+---------------
     estimated        --     |      --     |      --     |

   daily
                     rx      |     tx      |    total    |   avg. rate
     ------------------------+-------------+-------------+---------------
         today       184 KiB |     263 KiB |     447 KiB |    0.06 kbit/s
     ------------------------+-------------+-------------+---------------
     estimated        --     |      --     |      --     |
- -q, --query
- -d, --days # Show traffic for days.
- -h, --hours # Show traffic for the last 24 hours.
- -m, --months # Show traffic for months.
reset
- -r, --reset
PS:
vnstat дёҚиғҪеңЁ sub-interface дҪңзөұиЁҲ(eth0:0)
еңЁ 100 Mbitзҡ„ network, еҝ…й ҲиҰҒжҜҸ 5 minutes жӣҙж–°дёҖж¬Ў(еӨҡд№…жүҚиғҪеӮійҖҒ 4GB)
еңЁ1000 Mbit зҡ„ network, еҝ…й ҲиҰҒжҜҸ 30 seconds ж–°дёҖж¬Ў
* 64 bit kernels жІ’жңүжӯӨйҷҗ
Updates needs to be executed at least as often as it is possible for the interface to generate enough
traffic to wrap the kernel interface traffic counter. Otherwise it is possible that some traffic won't be seen.
Other
- vnstati - image output support for vnStat
ifstat
ifstat иҰҒдҫқжҮ¶дёҚе°‘еҢ… ~
ifstat
       eth0
 KB/s in  KB/s out
 1194.82      8.42
 1135.94      2.40
 1017.52      2.89
 1137.75      2.76
 1109.14      2.89
 1112.51      2.82
 1141.03      3.34
 1163.53      2.44
 1181.58      3.14
 1147.56      2.69
opts
-b Reports bandwith in kbits/sec instead of kbytes/sec.
iftop (pcap(3))
iftop monitor all network traffic on the interface (kvm host жңғиҰӢеҲ° vm guest зҡ„ traffic)
opts:
- -h Print a summary of usage.
- -n Don't do hostname lookups.
- -P Turn on port display.
- -N Do not resolve port number to service names
- -B bytes/sec ( Default: bits/sec )
- -i interface
- -c file <-- default: ~/.iftoprc
Centos6 Install:
http://pkgs.repoforge.org/iftop/
rpm -Uvh iftop-0.17-1.el6.rf.i686.rpm
Keyboard:
1, 2 or 3 sort by the 1st, 2nd or 3rd column.
o frozen
< or > sorted by source or destination hostname
t cycles through the four line display modes
Example:
iftop -nNB -i eth0
# By default, the pairs of hosts responsible for the most traffic (10 second average) are displayed at the top of the list.
19.1Mb 38.1Mb 57.2Mb 76.3Mb 95.4Mb
в””в”Җв”Җв”Җв”Җв”Җв”Җв”Җв”Җв”Җв”Җв”Җв”Җв”Җв”Җв”Җв”ҙв”Җв”Җв”Җв”Җв”Җв”Җв”Җв”Җв”Җв”Җв”Җв”Җв”Җв”Җв”Җв”ҙв”Җв”Җв”Җв”Җв”Җв”Җв”Җ
192.168.88.176 => 192.168.88.18 977Kb 1.06Mb 1.06Mb
<= 46.7Mb 52.4Mb 52.4Mb
192.168.88.176 => 192.168.88.177 2.30Kb 2.49Kb 2.49Kb
<= 160b 160b 160b
192.168.88.176 => 192.168.88.1 568b 461b 461b
<= 1.16Kb 954b 954b
192.168.88.255 => 192.168.88.29 0b 0b 0b
<= 0b 374b 374b
172.16.2.255 => 172.16.2.123 0b 0b 0b
<= 916b 183b 183b
в”Җв”Җв”Җв”Җв”Җв”Җв”Җв”Җв”Җв”Җв”Җв”Җв”Җв”Җв”Җв”Җв”Җв”Җв”Җв”Җв”Җв”Җв”Җв”Җв”Җв”Җв”Җв”Җв”Җв”Җв”Җв”Җв”Җв”Җв”Җв”Җв”Җв”Җв”Җв”Җ
TX: cumm: 1.33MB peak: 1.25Mb rates: 980Kb 1.07Mb 1.07Mb # 2, 10 and 40 sec. intervals
RX: 65.5MB 62.9Mb 46.7Mb 52.4Mb 52.4Mb
TOTAL: 66.9MB 64.1Mb 47.7Mb 53.5Mb 53.5Mb
filter
# will analyse packets flowing in and out of the 10.* network
-F 10.0.0.0/255.0.0.0
# in/out жҹҗ host зҡ„ web traffic
port http and not host webcache.example.com
nethogs - Net top tool
е®үиЈқ:
apt-get install nethogs
дҪҝз”Ё:
nethogs [device(s)]
- -r sort by 'received'
- -s sort by 'sent'
- -d delay for refresh rate.
  PID USER     PROGRAM                                 DEV        SENT      RECEIVED
7264  root     sshd: root@pts/0                        br0        1.720       0.091 KB/sec
?     root     ..05.83.180:20993-192.168.123.12:36213             0.000       0.039 KB/sec
?     root     ..68.123.12:56630-125.122.252.68:61105             0.000       0.079 KB/sec
?     root     ..68.123.12:32993-122.146.240.58:19000             0.000       0.233 KB/sec