жЬАеЊМжЫіжЦ∞: 2024-04-17
дїЛзіє
Program:
LSB executable
Monit can
- start a process if it does not run
- restart a process if it does not respond
- stop a process if it uses too much resources
- execute meaningful causal actions in error situations
monitor
- files, directories and filesystems for changes(timestamps , checksum, permission size changes)
- TCP/IP network checks
Version:
monit -V
This is Monit version 5.3.2зЫЃйМД
- Start Options
- Command
- Config file
- Service Poll Time (Poll cycle)
- My Settings
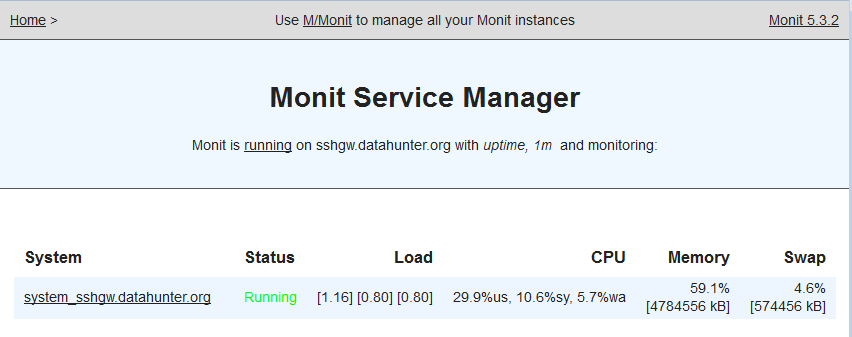
- Web-Interface
- Monit Action
-
еПѓзФ®зЪДзЫ£жЄђ(check)
System resource (CPU, Memory)
Disk Uage & I/O (filesystem)
Monitoring a directory
Monitoring files - йЗНи§Зжђ°жХЄ(within, for, on)
- Monit зЪД Limits
- Cheat Sheet
- Doc
Start Options
- -d n Run Monit as a daemon once per n seconds. (poll cycle) [Setting: set daemon n]
- -s statefile Write state information to this file. (A service's monitoring state is persistent across Monit restart)
- -l logfile
Command
- monitor <name | all>
mon a service
- unmonitor<name | all>
Disable monitoring of all services listed in the control file.
-
status
зЬЛеИ∞ webpanel жЬЙзЪДи≥ЗжЦЩ (дЇ¶еН≥жШѓи¶БжЬЙ webpanel enable жЙНзФ®еИ∞ !!)
monit status
The Monit daemon 5.3.2 uptime: 0m

System 'system_status'
  status                            Running
  monitoring status                 Monitored
  load average                      [0.51] [0.77] [0.81]
  cpu                               16.6%us 8.6%sy 1.0%wa
  memory usage                      4662296 kB [57.6%]
  swap usage                        577540 kB [4.7%]
  data collected                    Wed, 15 Jan 2014 16:04:15

Process 'ssh'
  status                            Running
  monitoring status                 Monitored
  pid                               20952
  parent pid                        1
  uptime                            6d 23h 54m
  children                          3
  memory kilobytes                  2424
  memory kilobytes total            8824
  memory percent                    0.0%
  memory percent total              0.1%
  cpu percent                       0.0%
  cpu percent total                 0.0%
  data collected                    Wed, 15 Jan 2014 16:04:15

...
- summary
# ж≤ТжЬЙ status йВ£йЇЉи©≥зі∞
monit summary
Monit 5.25.1 uptime: 26m вФМвФАвФАвФАвФАвФАвФАвФАвФАвФАвФАвФАвФАвФАвФАвФАвФАвФАвФАвФАвФАвФАвФАвФАвФАвФАвФАвФАвФАвФАвФАвФАвФАвФАвФђвФАвФАвФАвФАвФАвФАвФАвФАвФАвФАвФАвФАвФАвФАвФАвФАвФАвФАвФАвФАвФАвФАвФАвФАвФАвФАвФАвФАвФђвФАвФАвФАвФАвФАвФАвФАвФАвФАвФАвФАвФАвФАвФАвФАвФР вФВ Service Name вФВ Status вФВ Type вФВ вФЬвФАвФАвФАвФАвФАвФАвФАвФАвФАвФАвФАвФАвФАвФАвФАвФАвФАвФАвФАвФАвФАвФАвФАвФАвФАвФАвФАвФАвФАвФАвФАвФАвФАвФЉвФАвФАвФАвФАвФАвФАвФАвФАвФАвФАвФАвФАвФАвФАвФАвФАвФАвФАвФАвФАвФАвФАвФАвФАвФАвФАвФАвФАвФЉвФАвФАвФАвФАвФАвФАвФАвФАвФАвФАвФАвФАвФАвФАвФАвФ§ вФВ myserver вФВ OK вФВ System вФВ вФЬвФАвФАвФАвФАвФАвФАвФАвФАвФАвФАвФАвФАвФАвФАвФАвФАвФАвФАвФАвФАвФАвФАвФАвФАвФАвФАвФАвФАвФАвФАвФАвФАвФАвФЉвФАвФАвФАвФАвФАвФАвФАвФАвФАвФАвФАвФАвФАвФАвФАвФАвФАвФАвФАвФАвФАвФАвФАвФАвФАвФАвФАвФАвФЉвФАвФАвФАвФАвФАвФАвФАвФАвФАвФАвФАвФАвФАвФАвФАвФ§ вФВ public вФВ OK вФВ Network вФВ вФФвФАвФАвФАвФАвФАвФАвФАвФАвФАвФАвФАвФАвФАвФАвФАвФАвФАвФАвФАвФАвФАвФАвФАвФАвФАвФАвФАвФАвФАвФАвФАвФАвФАвФівФАвФАвФАвФАвФАвФАвФАвФАвФАвФАвФАвФАвФАвФАвФАвФАвФАвФАвФАвФАвФАвФАвФАвФАвФАвФАвФАвФАвФівФАвФАвФАвФАвФАвФАвФАвФАвФАвФАвФАвФАвФАвФАвФАвФШ
- reload # The daemon will reread its configuration, close and reopen log files.
- quit
-
validate # Check all services listed in the control file (зЫЄзХґжЦЉдЇЇжЙЛи°МдЄАжђ°)
# Default behavior when Monit runs in daemon mode
... info     : Awakened by User defined signal 1
... info     : Monit daemon with PID 536802 awakened
- start / stop / restart
start <all | name>
stop <all | name>
restart <all | name>
i.e.
# Start all services listed in the control file and enable monitoring for them.
monit start all
Config File
жМЗеЃЪзФ®еП¶дЄАеАЛ config file:
monit -c /var/monit/monitrc
Default config file:
# If this file does not exist, Monit will try /etc/monitrc
~/.monitrc
Service зЪД config file(service monit start):
/ect/monitrc
...
include /etc/monit.d/*.cfg
Test Config File Syntax
monit -t
output:
Control file syntax OK
Global Setting
# Monit's poll cycle # Monit detaches from the console, goes to sleep for the given poll interval, # wakes up and start monitoring again in an endless cycle set daemon 20 with start delay 120 # Log Setting set logfile /var/log/monit.log # unique id for the Monit instance set idfile /var/lib/monit/id # saves monitoring states on each cycle. set statefile /var/lib/monit/state # Multiple servers may be specified using a comma separator # (If the first mail server fails, Monit will use the second mail server in the list) set mailserver smtpgw1, smtpgw2 port 1025, localhost # fallback relay # By default, the queue is disabled and if the alert handler fails, # Monit will simply drop the alert message. set eventqueue basedir /var/lib/monit/events # set the base directory where events will be stored slots 100 # optionally limit the queue size # mail format set mail-format { from: [email protected] } # еПѓдї•е§Ъи°М "set alert" и®≠еЃЪ # Event: # instance # timeout # action # Action failed/done # set alert [email protected] not on { instance } # reload => Monit instance changed set alert [email protected] only on { timeout } # receive just service timeout alert # built-in mini-httpd server set httpd port 2812 and use address localhost allow localhost allow admin:ClearTextPW include /etc/monit.d/*.conf
Config file permission:
# дЄАеЃЪи¶БйАЩеАЛ permission
chow root: /etc/monit.conf
chmod 600 /etc/monit.conf
with start delay
и¶БеїґйБ≤е§ЪиАР(зІТ)жЙНйЦЛеІЛ mon
жЬЯйЦУ monit status зД°жХИ
Cannot create socket to [localhost]:2812 -- Connection refused
Log
log to file
set log /var/log/monit.log
log to syslog
set log syslog
Service Poll Time (Poll cycle)
дЄАеЕ±жЬЙеЕ©з®ЃжЦєеЉП:
- EVERY [number] CYCLES
- EVERY [cron]
Example:
# cycles # жѓП "set daemon N" зЪД 2N и°МдЄАжђ° check process nginx with pidfile /var/run/nginx.pid every 2 cycles # cron # cron jobs format. жШЯжЬЯдЄАиЗ≥дЇФ, 8 a.m. йїЮиЗ≥ 7 p.m еЕІзЪДжѓПеИЖйРШ check program nginx with pidfile /var/run/nginx.pid every "* 8-19 * * 1-5"
P.S.
Strongly recommend to use an asterix in the minute field or at minimum a range,
* Never use a specific minute as Monit may not run on that minute.
еЫ†зВЇ monit зЪД scheduler жШѓ serial polling, жЙАдї•дЄНиГљдњЭи≠ЙеЯЈи°МжЩВйЦУ
e.g.
# a range
0-15
My Settings
Centos 6
/etc/logrotate.d/monit
/var/log/monit.log {
    missingok
    notifempty
    size 100k
    create 0644 root root
    postrotate
        # /bin/systemctl reload monit.service > /dev/null 2>&1 || :
        /sbin/service monit condrestart > /dev/null 2>&1 || :
    endscript
}
и°Мдї•дЄЛ cmd еЕИ ~
mkdir /var/lib/monit
rm /etc/monit.d/logging
/etc/monit.conf
# My Basic Config

set daemon 10 with start delay 60

set logfile /var/log/monit.log

set idfile /var/lib/monit/id
set statefile /var/lib/monit/state

set mailserver localhost
set alert xxx@xxx

set httpd port 2812 and
    use address localhost
    allow localhost

include /etc/monit.d/*.conf
RHEL 8
set daemon 10
        with start delay 60

set idfile /var/lib/monit/id
set statefile /var/lib/monit/state

set mailserver localhost
set alert [email protected]

set httpd unixsocket /var/run/monit.sock
    permission 600
    allow localhost

check system $HOST
    if loadavg (1min) per core > 2 for 5 cycles then alert
    if loadavg (5min) per core > 1.5 for 10 cycles then alert
    if cpu usage > 95% for 10 cycles then alert
    if memory usage > 80% then alert
    if swap usage > 80% then alert

include /etc/monit.d/*
Notes
* дЄНзФ®еК† "set log syslog" еЫ†зВЇжЬЙ /etc/monit.d/logging
* еїЇзЂЛзЫЃйМД /var/lib/monit еОїжФЊ idfile еПК statefile, еР¶еЙЗжЬГжФЊеЬ® /root/{.monit.id,.monit.state}
* "set httpd unixsocket" ењЕй†ИеК† "allow localhost" жЙНзФ®еИ∞
* include дЄНзФ® *.conf, еЫ†зВЇ upgrade еЊМеПИжЬГжЬЙ /etc/monit.d/logging
Web-Interface
Default: Disable.
Default TCP port 127.0.0.1:2812
* If security is a concern, bind the HTTP interface to localhost / Unix Socket
Monit HTTPD Authentication:
set httpd port 2812
    allow localhost
    allow 10.1.1.1
    allow 192.168.1.0/255.255.255.0
    allow 10.0.0.0/8
    allow myuser:mypassword
    allow md5 /etc/httpd/htpasswd john paul ringo george
* allow еАСжШѓ "AND" зЪДйЧЬдњВ
Web UI:
UNIX SOCKET
SET HTTPD UNIXSOCKET <path>
    [UID <uid | username>]
    [GID <gid | groupname>]
    [PERMISSION <octal number>]
    ...
UID, GID
optional, defaults to the user who executes Monit
PERMISSION
optional, absolute octal mode
i.e.
set httpd unixsocket /var/run/monit.sock
    permission 600
    allow localhost
signature
hide Monit version
set httpd
  port 2812
  signature disable
Monit Action
Available actions
IF <TEST> THEN ACTION
ACTION:
- alert
- restart # restarts the service and sends an alert
- start
- stop
- exec # EXEC can be used to execute an arbitrary program and send an alert.
- unmonitor
EXEC (йЗНйїЮ: repeat, as)
repeat
The program is executed only once if the test fails.
You can enable execute repetition if the error persists for a given number of cycles:
# зХґжѓПеАЛ cycles дњВ 30 зІТжЩВ(set daemon 30), дї•дЄЛи®≠еЃЪеН≥жѓП 5 еИЖжЮР.
if failed <test> then exec "/usr/local/bin/sms.sh"
     as uid "nobody" and gid "nobody"
     repeat every 10 cycles
as
# You may optionally specify the uid and gid
exec "/root/scripts/fixit.sh" as uid nobody and gid nobody* If Monit is run by root, then all programs executed by Monit will be started with superuser privileges
ж≥®жДП, е¶ВжЮЬжШѓ shell script, йВ£ Script дЄАеЃЪи¶Б "#!/bin/bash"
Notes
ALERT зФ® "WITH REMINDER ON N CYCLES", EXEC зФ® "REPEAT EVERY N CYCLES"
i.e.
CHECK HOST MyVPN ADDRESS 192.168.88.20
  ALERT [email protected] WITH REMINDER ON 2 CYCLES
  IF FAILED PING
    COUNT 5
    THEN EXEC /home/fortivpn/vpn/start-vpn.sh
    AS uid fortivpn AND gid fortivpn
    REPEAT EVERY 2 CYCLES
Service Monitoring Mode
MODE < ACTIVE | PASSIVE >
- ACTIVE: raise alerts and restart the service # DEFAULT
- PASSIVE: raise alerts only
i.e.
# Monit will not try to (re)start this service if it is not running:
check process sybase with pidfile /var/run/sybase.pid
  mode passive
  start = "/etc/init.d/sybase start"
  stop  = "/etc/init.d/sybase stop"
еПѓзФ®зЪДзЫ£жЄђ(check)
SYSTEM, FILESYSTEM, PROCESS ...
- CHECK SYSTEM <unique name> # з≥їзµ±и≥ЗжЇР
- CHECK FILESYSTEM <unique name> PATH <path> # Disk IO еПК Space Usage
- CHECK PROCESS <unique name> <PIDFILE path | MATCHING regex>
- CHECK FILE <unique name> PATH <path>
- CHECK FIFO <unique name> PATH <path>
- CHECK DIRECTORY <unique name> PATH <path>
- CHECK HOST <unique name> ADDRESS <host address>
- CHECK PROGRAM <unique name> PATH <executable file> [TIMEOUT <number> SECONDS]
PROGRAM
If the program does not finish executing within <number> seconds,
Monit will terminate it. The default program timeout is 300 seconds
The "status test" allows one to check the program's exit status.
IF STATUS operator value THEN action
System resource (CPU, Memory)
To monitor general system resources such as CPU usage, total memory usage or load average.
If you use the variable $HOST as the name, it will expand to the hostname.
CPU
$HOST жЬГжШѓ hostname
check system $HOST
  if loadavg (1min) > 4 then alert
  if loadavg (5min) > 2 then alert
  if memory usage > 75% for 6 cycles then alert
  if swap usage > 25% then alert
  if cpu usage > 95% for 10 cycles then alert
  if cpu usage (user) > 70% then alert
  if cpu usage (system) > 30% then alert
  if cpu usage (wait) > 20% then alert
Memory usage
What does monit consider to be memory usage?
# On latest Monit (ie: 5.25.x) the memory usage value accounts for ZFS ARC cache
Code
si->memory.usage.bytes = systeminfo.memory.size - zfsarcsize - (uint64_t)(mem_free + buffers + cached + slabreclaimable) * 1024;
# е∞НжѓФ
monit status | grep 'memory usage'
memory usage 2.5 GB [32.4%]
grep -w -e MemTotal -e Buffers -e Cached -e MemFree -e Slab /proc/meminfo
MemTotal:        8060728 kB
MemFree:          375184 kB
Buffers:          652612 kB
Cached:          3048636 kB
Slab:            1472140 kB
Usage = MemTotal - MemFree - Buffers - Cached - Slab = 2.45 G
Network
* Unit: Byte
# 10 min up/down > 5 MByte
# 1 hr up size > 4 GByte
check network public with interface eth0
    if failed link then alert
    if changed link then alert
    if download > 5 MB/s for 20 cycles then alert
    if upload > 5 MB/s for 20 cycles then alert
    if total uploaded > 4 GB in last hour then alert
Disk I/O (filesystem)
Monit will normally need to run as the root user to access this metrics.
# Unit: "B","KB","MB","GB"
i.e.
check filesystem datafs with path /dev/sda1
    # Usage
    if space usage > 90% then alert
    if inode usage > 90% then alert
    # IO
    if read rate > 10 MB/s for 5 cycles then alert
    if read rate > 500 operations/s for 5 cycles then alert
    if write rate > 10 MB/s for 5 cycles then alert
    if write rate > 500 operations/s for 5 cycles then alert
    if service time > 10 milliseconds for 3 times within 5 cycles then alert
* Per-process I/O activity statistics by platform: Byte
Service time per operation
Service Time is the time taken to complete a read or a write operation.
If it grows, it means that the disk is not able to handle the operations fast enough.
# Unit is "ms" (millisecond) or "s" (second)
if service time > 10 milliseconds
    for 3 times within 5 cycles
then alert
Monitoring a directory
check directory bin with path /bin
    if failed permission 755 then unmonitor
    if failed uid 0 then unmonitor
    if failed gid 0 then unmonitor
Monitoring file
TEST:
- IF FAILED [MD5|SHA1] CHECKSUM [EXPECT checksum] THEN action
- IF CHANGED [MD5|SHA1] CHECKSUM THEN action
- IF TIMESTAMP [[operator] value [unit]] THEN action
- IF CHANGED TIMESTAMP THEN action
- IF [DOES] NOT EXIST THEN action
- IF SIZE [[operator] value [unit]] THEN action
- IF CHANGED SIZE THEN action
Changed checksum
if failed
   checksum expect 8f7f419955cefa0b33a2ba316cba3659
then alert
OR
if changed checksum then exec "/usr/bin/apachectl graceful"
Changed timestamp (unit: "SECOND", "MINUTE", "HOUR" or "DAY")
# If the file is older then N minutes, then things are broken
IF TIMESTAMP > 1 MINUTE THEN alert
EXIST
IF [DOES] NOT EXIST THEN action
PERMISSION TESTING
- IF FAILED PERM(ISSION) octalnumber THEN action
- IF FAILED [E]UID user THEN action
- IF FAILED GID group THEN action
Example:
 check file shadow with path /etc/shadow
       if failed permission 0640 then alert

 check file shadow with path /etc/shadow
       if failed uid root then alert

 check file shadow with path /etc/shadow
       if failed gid shadow then alert
йЗНи§Зжђ°жХЄ(within, for, on)
WITHIN
[[<X>] [TIMES WITHIN] <Y> CYCLES]
IF CHANGED <TEST> [[<X>] [TIMES WITHIN] <Y> CYCLES] THEN ACTION
e.g.
# An alert is delivered each time the condition becomes true.
# tenth cycle if a service remains in a state
alert foo@bar with reminder on 10 cycles
# tcp port 80 еЬ® 5 cycles еЕІжЬЙ 3 жђ°зД°еПНжЗЙжЩВеЗЇ alert
if failed port 80 for 3 times within 5 cycles then alert
# йА£зЇМдЄАжЃµжЩВйЦУ:
if cpu is greater than 50% for 5 cycles then restart
# йЩРеИґ restart зЪДжђ°жХЄ (IF N RESTART WITHIN M CYCLES THEN <action>)
# restarted 2 times within 3 cycles
if 2 restarts within 3 cycles then unmonitor
FOR
Requires X consecutive events before switching the state
# cycle is failure (1-0-1-0-1-0-...), then "for 2 cycles" condition will never match
if failed
   port 80
   for 2 cycles
then alert
ON
alert foo@bar with reminder on 10 cycles
Monit зЪД Limits
monit иЗ™иЇЂзЪД resource limit
Default values:
set limits {
    programOutput:     512 B,      # check program's output truncate limit
    sendExpectBuffer:  256 B,      # limit for send/expect protocol test
    fileContentBuffer: 512 B,      # limit for file content test
    httpContentBuffer: 1 MB,       # limit for HTTP content test
    networkTimeout:    5 seconds   # timeout for network I/O
    programTimeout:    300 seconds # timeout for check program
    stopTimeout:       30 seconds  # timeout for service stop
    startTimeout:      30 seconds  # timeout for service start
    restartTimeout:    30 seconds  # timeout for service restart
}
Cheat Sheet
monit -t # syntax checking
monit reload # config file жЫіжЦ∞еЊМењЕй†И reload, еР¶еЙЗ "monitor <name>" еПНжШ†дЄНеИ∞жЦ∞ settings
monit summary # зіФзЬЛ Status(OK|Initializing)
monit status # жЬЙ process зЪД info (uptime, threads, children, cpu, memory, io)
Doc
# еЊИеЃМжХізЪД doc