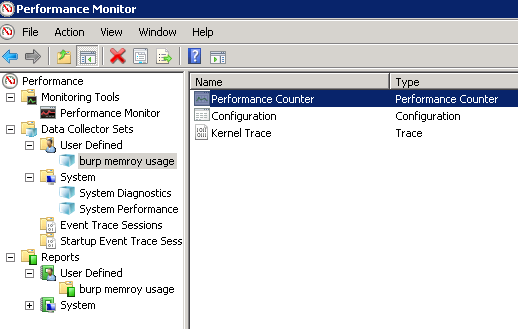
perfmon.exe
иЁӯе®ҡ Perfomance Counter
Perfomance Counter = CPU, Memory, IO, Network ...
Performance Objects
"Network Interface" object
- Bytes Received/sec
- Bytes Transmitted/sec
TCPv4 object
- Segments/sec
- Connections Active
- Connections Established
LogicalDisk object
- Disk Read Bytes/sec
- Disk Write Bytes/sec
-
Physical Disk: Avg. Disk Queue Length
# If this number is greater than the number of spindles in your array, you have a problem -
Split IO/sec
# A large number of split IO/s indicates that the disk is fragmented and performance is being affected
"Memory" object
AvailableMBytes
immediately available for allocation to a process or for system use.
It is equal to the sum of memory assigned to the standby (cached), free, and zero page lists.
Pages Faults/sec
this includes soft faults, hard faults and file cache faults.
Pages/sec
the rate at which pages are read from or written to disk to resolve hard page faults.
Causes
too high => One or more applications are using memory heavily
"Processor performance" object
"% Processor Time"
the percentage of elapsed time that the processor spends to execute a non-Idle thread.
Process objects
Process-->Private Bytes (for each process you want to examine)
Process-->Virtual Bytes (for each process you wish to examine)
perfmon "Data Manager..."
Minimum Free Disk The amount of disk space that must be available on the drive where log data is stored.
Resource Policy that you choose when the limit is reached
- previous data is deleted
- Delete Oldest The oldest folder within the DCS root folder is deleted
з№Әең–
* Value X Scale д№ӢеҫҢеҮәең–зҡ„ 0~100
Report