жңҖеҫҢжӣҙж–°: 2016-01-14
Memory Dump Location
Full Dump:
%SystemRoot%\MEMORY.DMP
MiniDump Folder:
%SystemRoot%\MiniDump
Name:
051814-23540-01.dmp
Download
To install the debugging tools, see the Download and Install Debugging Tools for Windows webpage.
http://msdn.microsoft.com/en-us/windows/hardware/gg463009.aspx
# win7
* winsdk_web.exe
# win8
# Debugging Tools for Windows are included in the WDK 8.1
* sdksetup.exe
Install Path:
win7
C:\Program Files\Debugging Tools for Windows (x64)
s2012
C:\Program Files\Windows Kits\8.1\Debuggers\x64
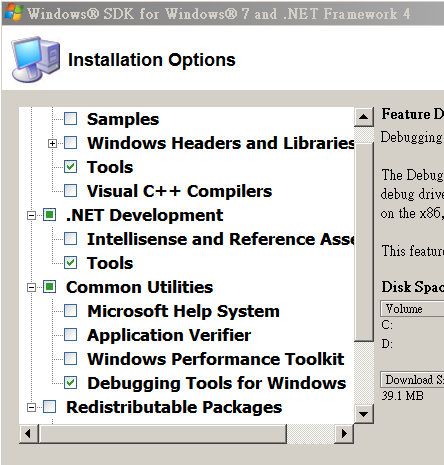
Install
е®үиЈқйҒҺзЁӢйҒё "Debugging Tools for Windows" еҚіеҸҜ
Usage
Sample 1: command line version
kd -y srv*c:\symbols*http://msdl.microsoft.com/download/symbols -i c:\windows\i386 -z c:\windows\minidump\minidump.dmp
Sample 2: graphical version of the debugger
windbg.exe -y srv*c:\symbols*http://msdl.microsoft.com/download/symbols -i c:\windows\i386 -z c:\windows\MEMORY.DMP
-z (ctrl+d)
Sample 3:
windbg.exe -y srv*c:\symbols*http://msdl.microsoft.com/download/symbols -z c:\windows\MEMORY.DMP
*******************************************************************************
*                                                                             *
*                        Bugcheck Analysis                                    *
*                                                                             *
*******************************************************************************

Use !analyze -v to get detailed debugging information.

BugCheck 24, {1904fb, fffff880045ab678, fffff880045aaed0, fffff80003ca19be}

Probably caused by : Ntfs.sys ( Ntfs!NtfsDeleteFcb+179 )

Followup: MachineOwner
---------
Options
"!analyze" # displays information about the current exception or bug check.
# displays verbose output.
!analyze -v
# Displays information about the bug check specified by BugCheckCode.
!analyze -show BugCheckCode
lm (List Loaded Modules)
lmsm # Sorts the display by module name instead of by the start address.
lmvm # v: Causes the display to be verbose; m: Specifies a pattern that the module name must match.
Debugger Commands
https://msdn.microsoft.com/en-us/library/windows/hardware/ff540507(v=vs.85).aspx
file & path
SymbolPath
Either the local path where the symbol files have been downloaded or the symbol server path, including a cache folder. Because a small memory dump file contains limited information, the actual binary files must be loaded together with the symbols for the dump file to be correctly read.
ImagePath
The path of these files. The files are contained in the I386 folder on the Windows XP CD-ROM. For example, the path may be C:\Windows\I386.
DumpFilePath
The path and file name for the dump file that you are examining.
Windows symbols
The easiest way to get Windows symbols is to use the Microsoft Symbol Server.
The symbol server makes symbols available to your debugging tools as needed.
-y srv*c:\symbols*http://msdl.microsoft.com/download/symbols
Other Tools - BlueScreenView
http://www.nirsoft.net/utils/blue_screen_view.html
| йҷ„еҠ жӘ”жЎҲ | еӨ§е°Ҹ |
|---|---|
| sdksetup.exe | 974.66 KB |
| winsdk_web.exe | 497.33 KB |